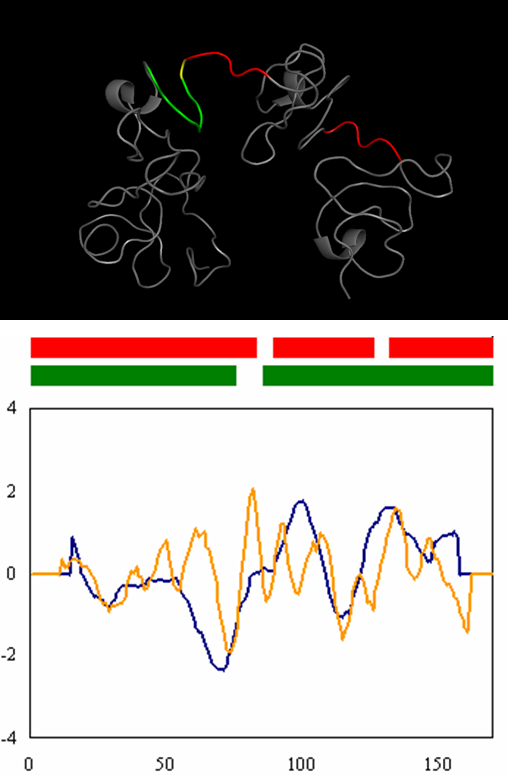
The red and green regions represent respectively the predicted and structure-defined domain linker.
Regions where the prediction and the domain-based definition overlap are shown in yellow.
Red and green bars indicate the structure-derived domain regions and the predicted domain regions respectively.
In the lower panel, the holizontal axis represents the sequence position
while the vertical axis represents the Z-Score of each SVM.
The Z-Scores of SVM-Long and SVM-Short are shown with blue and orange lines respectively.